2025 was a good year for investment pundits, but my hopes aren’t so high for the year ahead.
Every year since 2022, the investment research site Trustnet has published a list of the most discussed funds on “best buy” lists.
It covers ideas from 5 of the UK’s biggest investment providers – AJ Bell, Barclays, Hargreaves Lansdown, Fidelity, and Interactive Investor.
Each list has around 50 or more funds across sectors, and Trustnet look at the funds that make at least 3 of the lists.
What they don’t seem to do however, is look at how last years recommendations actually played out.
Don’t worry – I’ve got you covered.
How should fund recommendations be evaluated?
The funds cover a range of sectors, mostly equities, but everything from equity income, smaller companies, US stocks, Asian stocks, bonds, gold, and even special situations.
Now you could rationalise comparing these to sector benchmarks. But it would be a fools errand.
If you were recommending a fund, surely you would only do so, because you have conviction it is a great investment.
What I mean to say is, you wouldn’t recommend a UK small company fund, if you thought the sector was a dog. The fund might beat the sector benchmark, but it still wouldn’t be a good investment.
So a fair benchmark would be a market portfolio – like the MSCI All Country World Index – which tracks 47 global markets.
How did the best-buy lists actually perform?
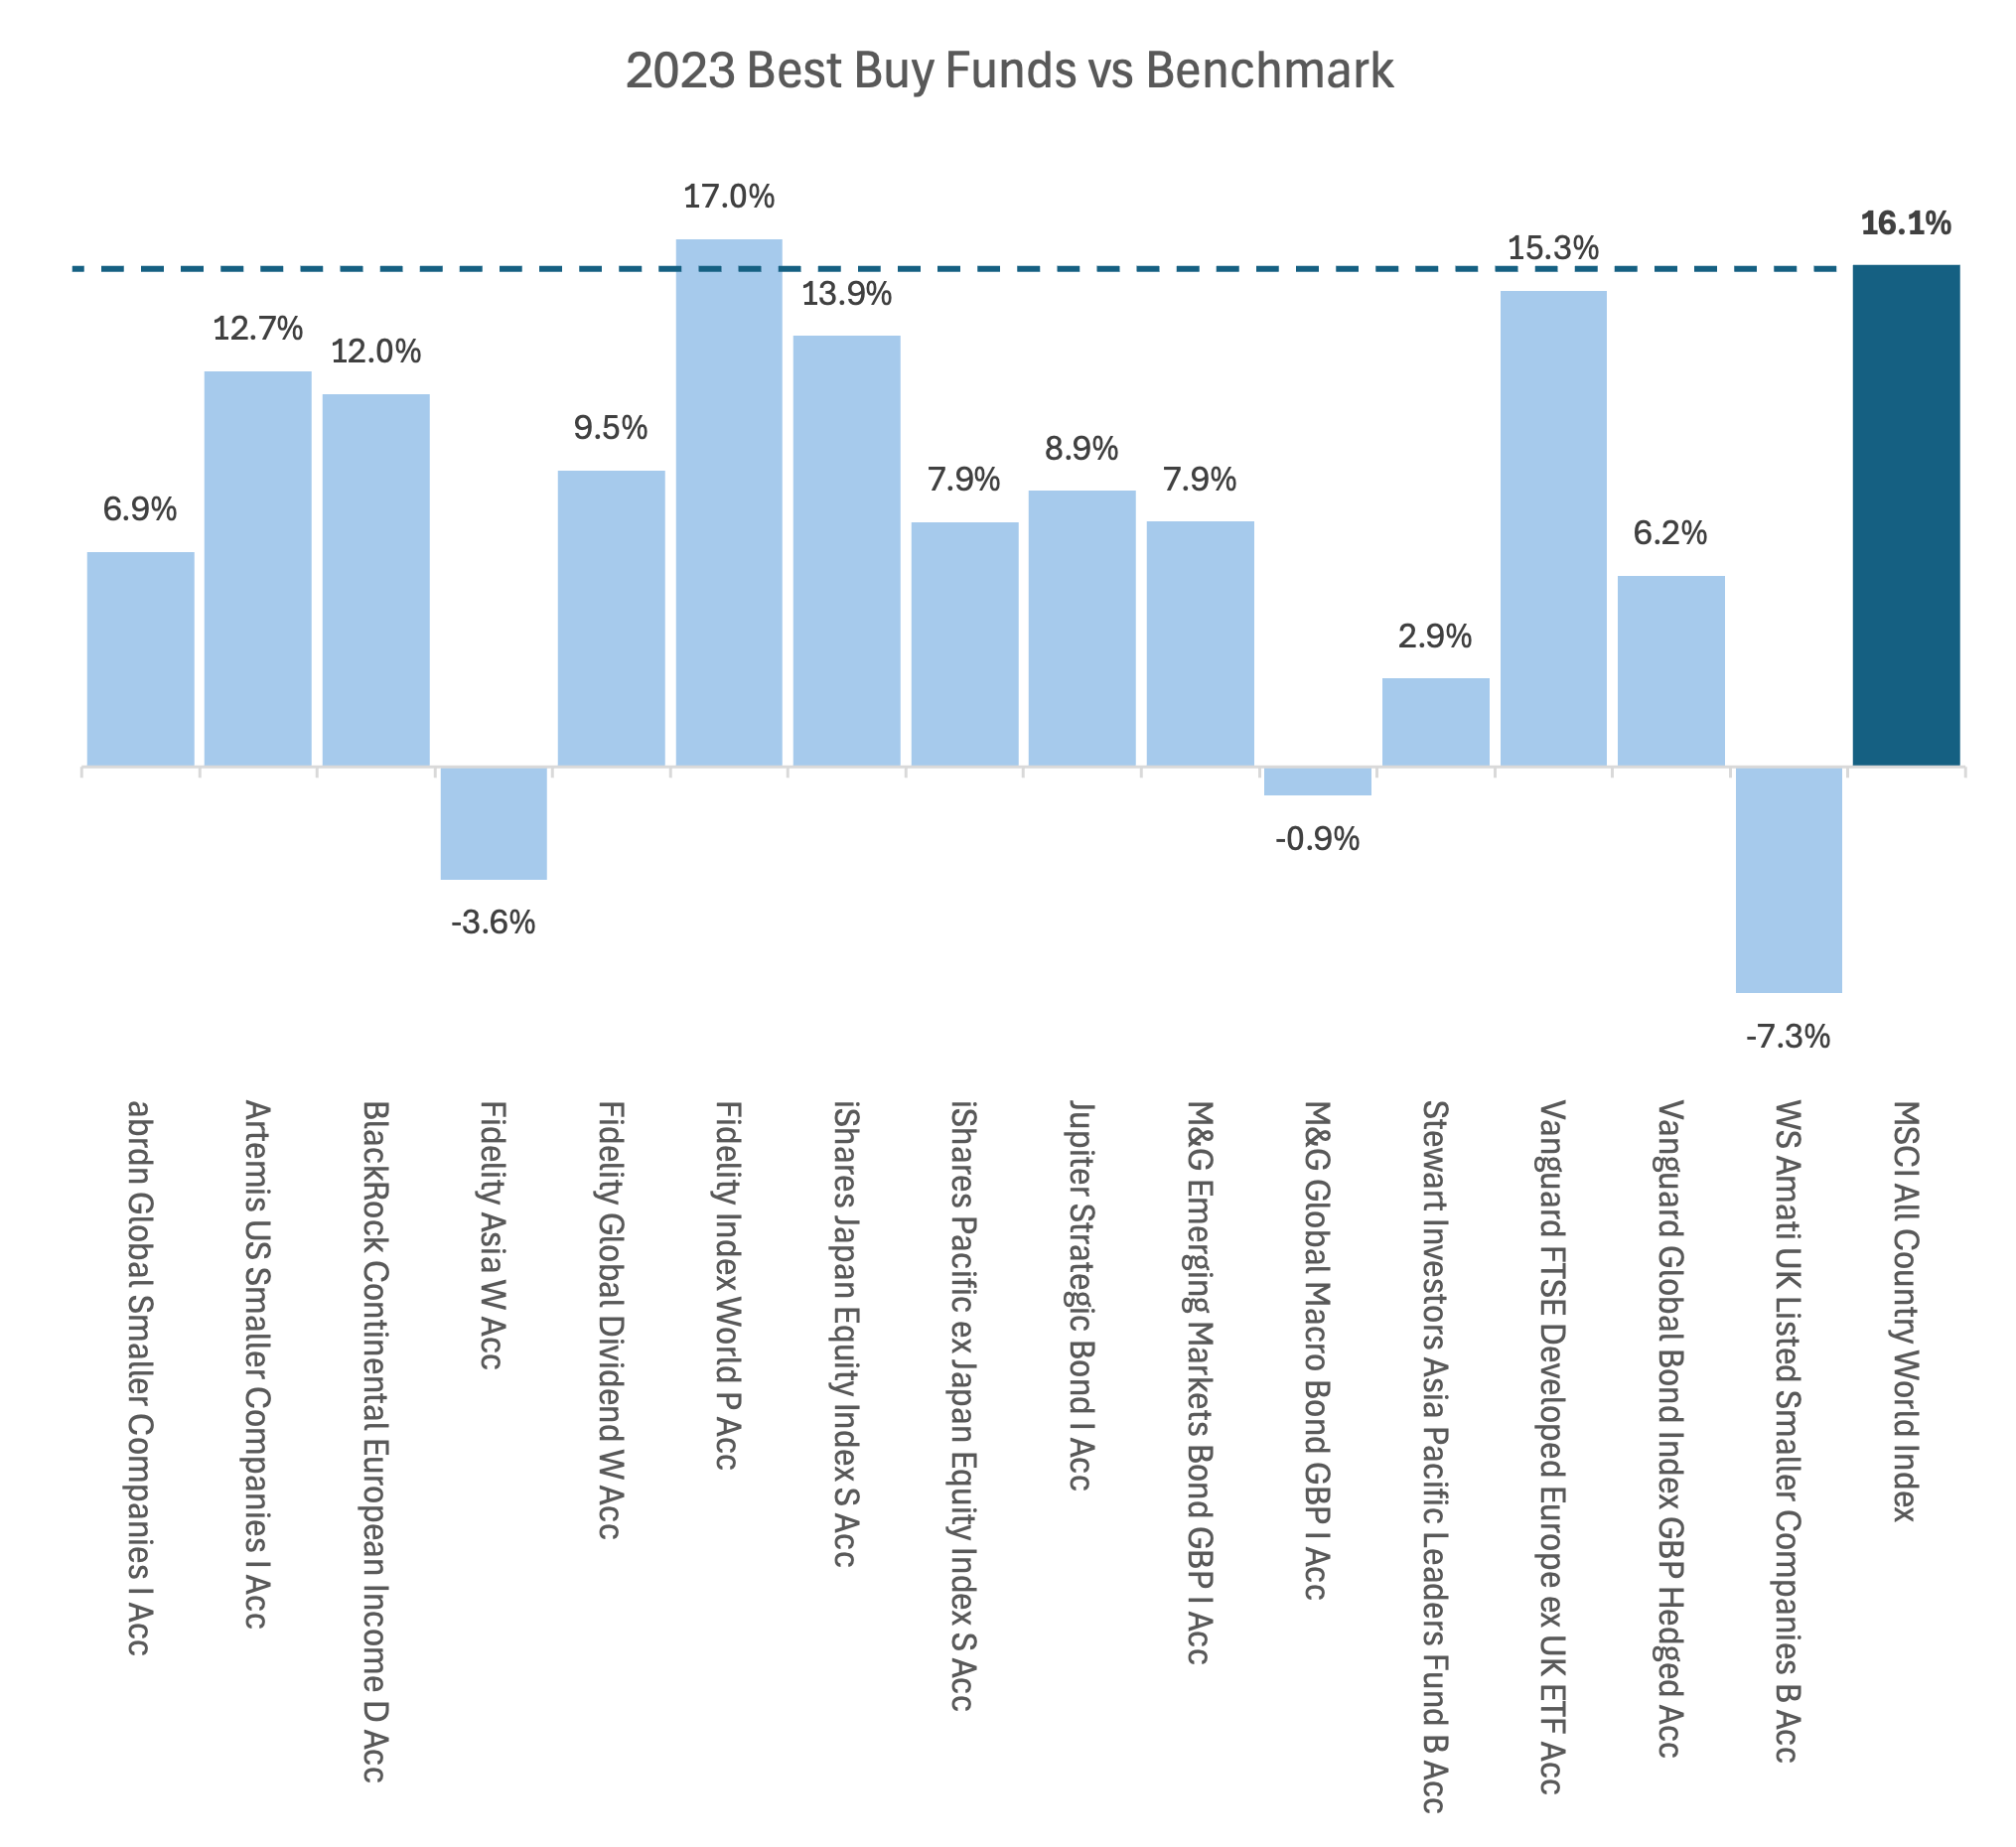
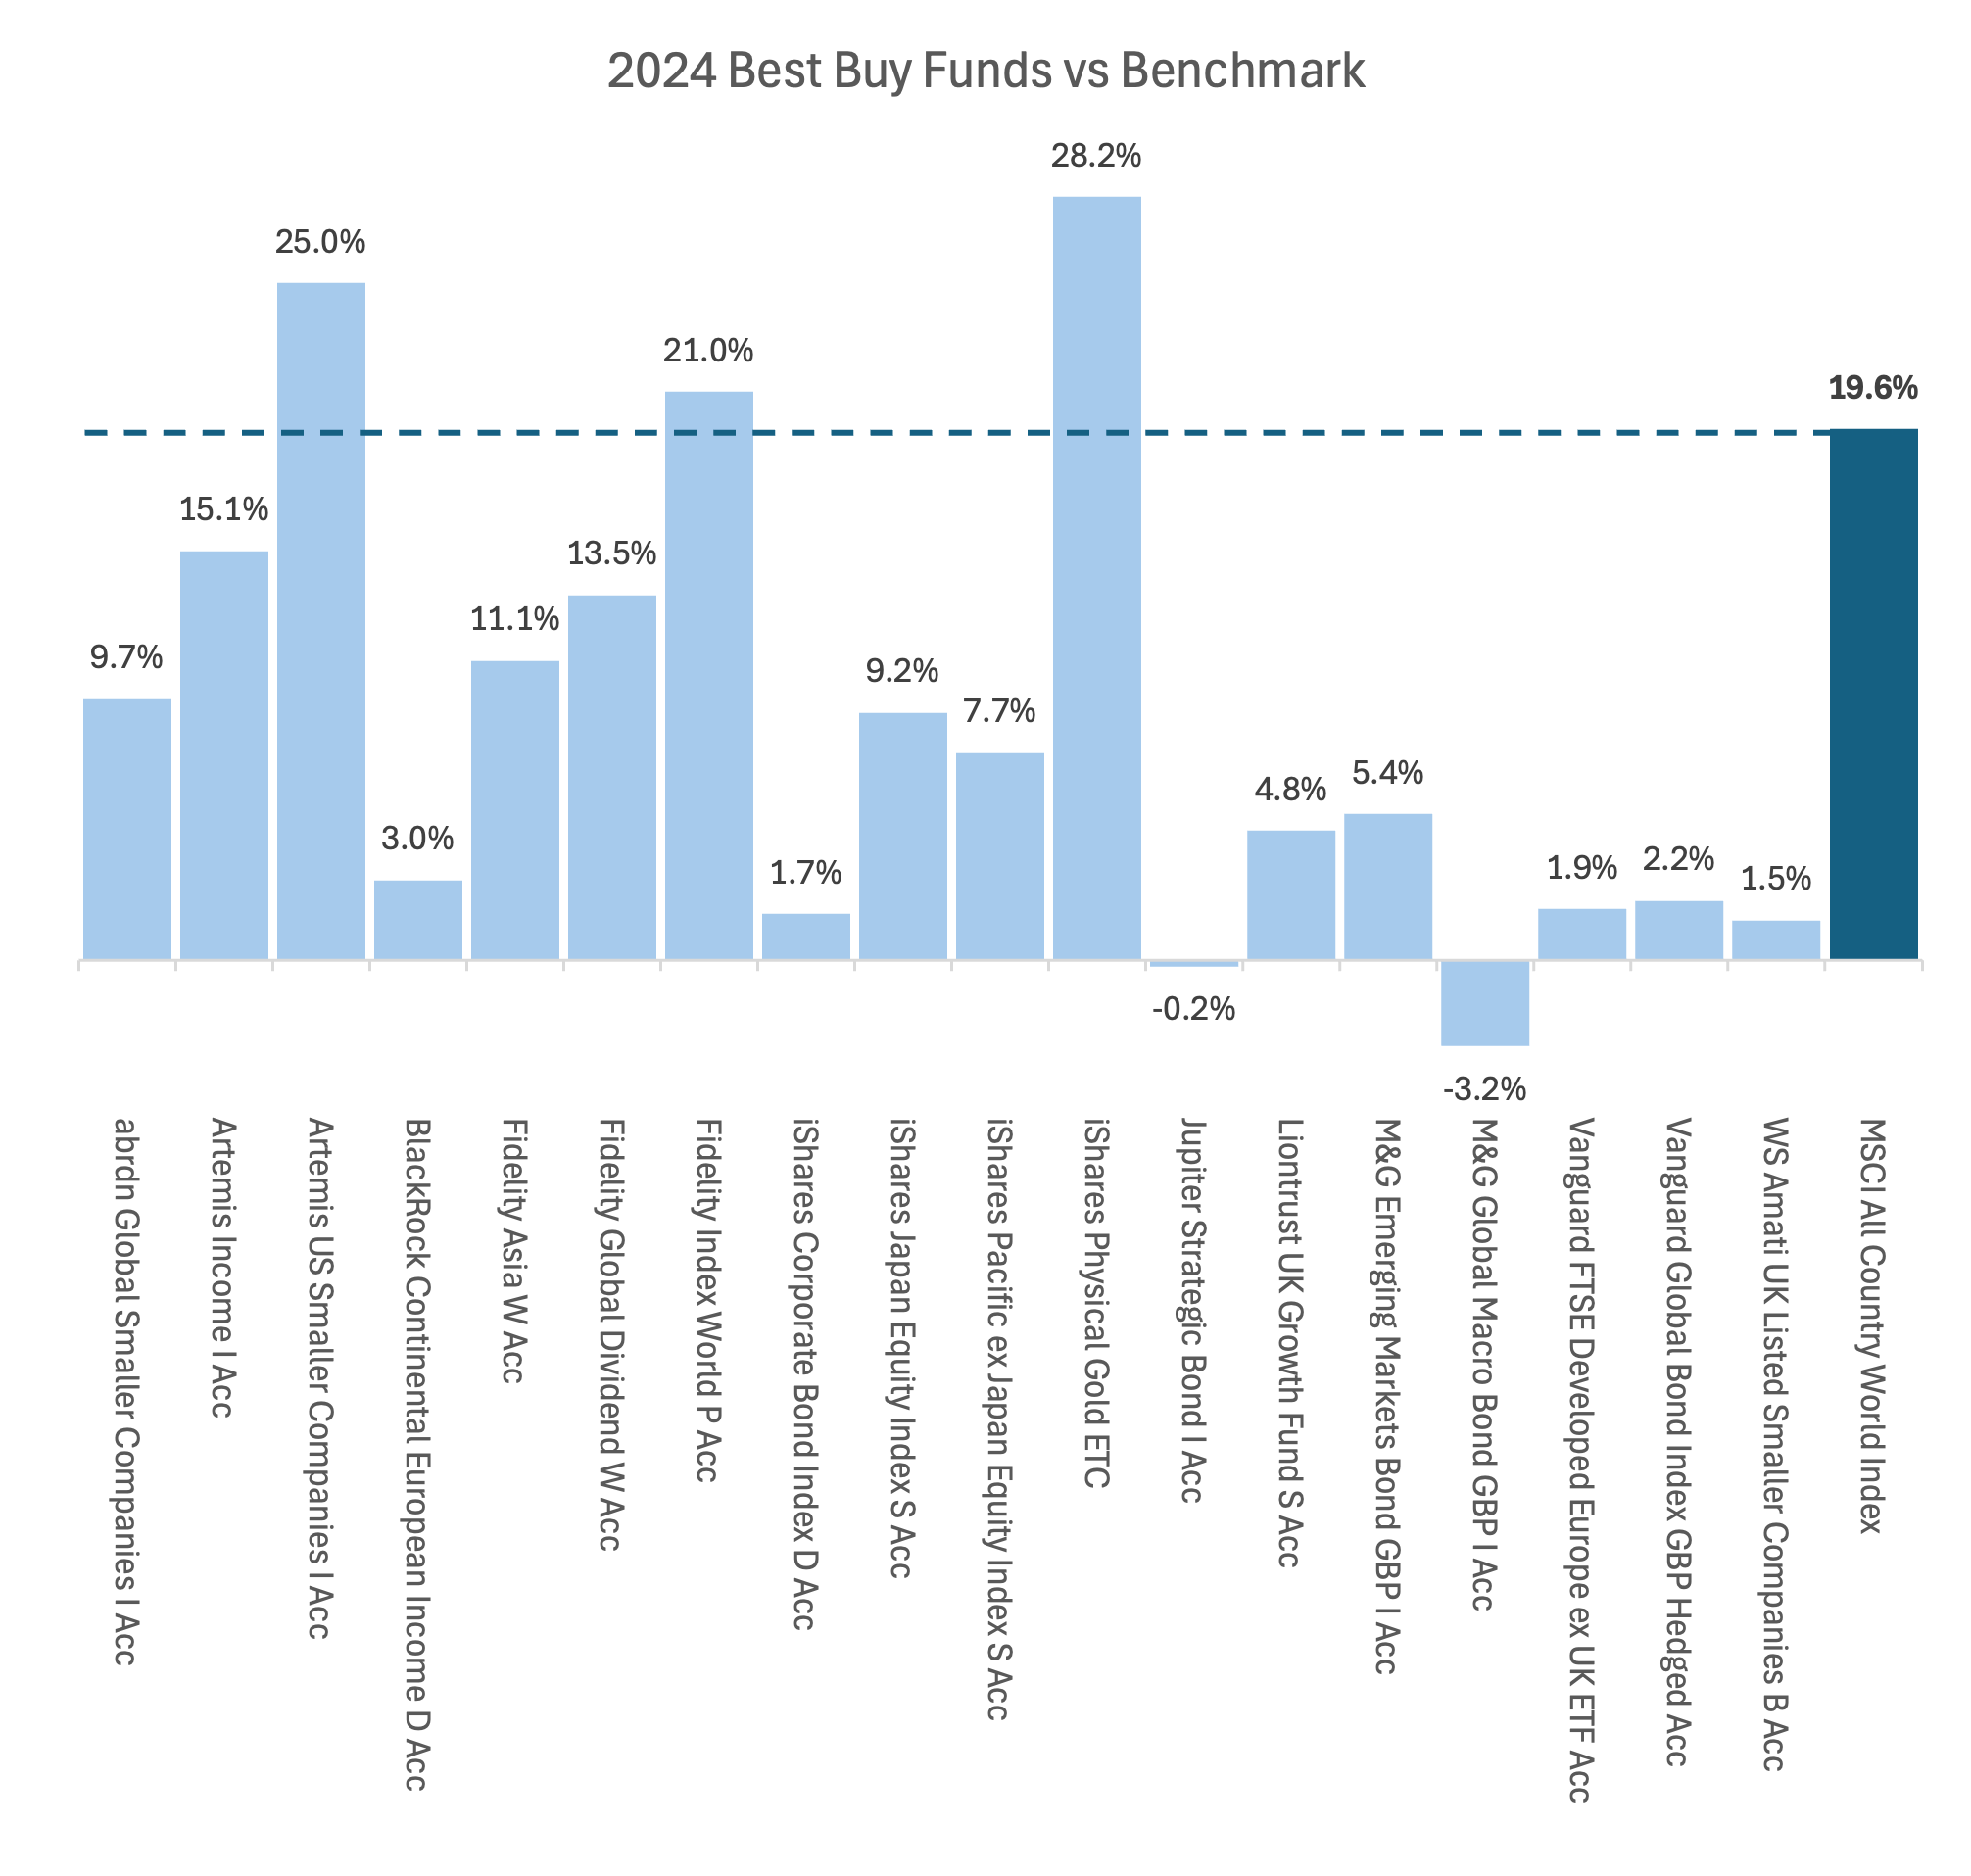
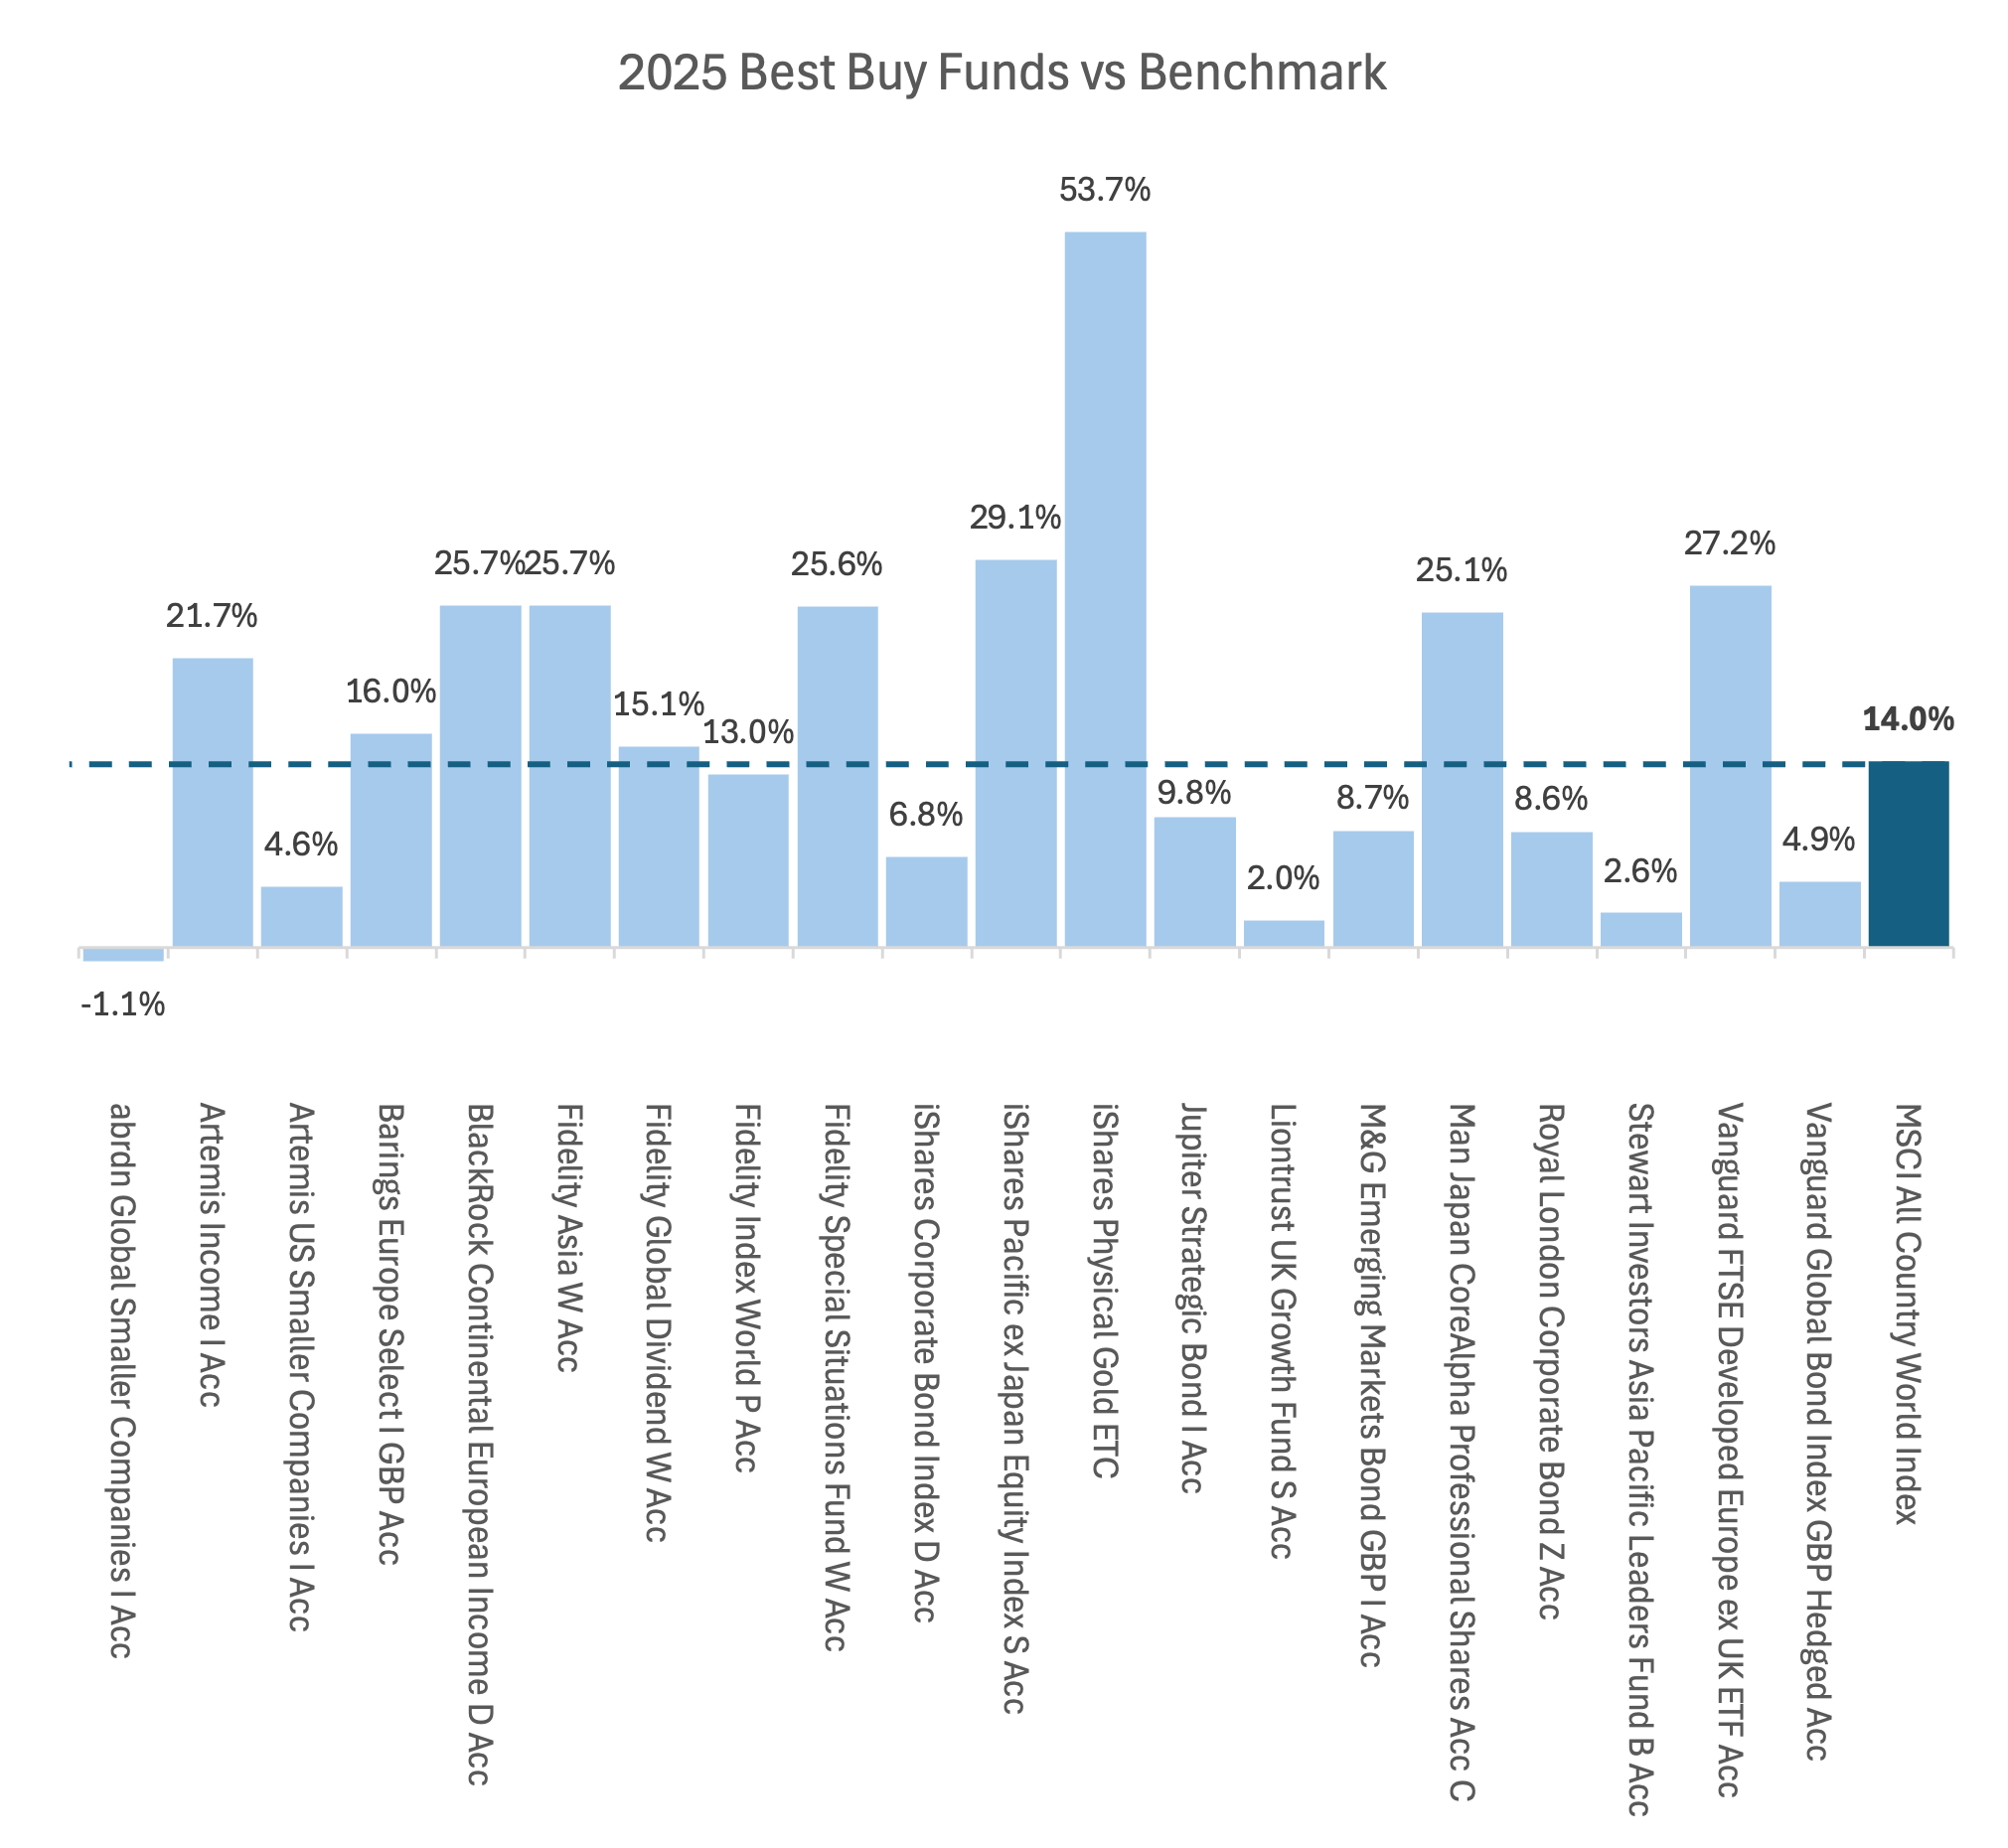
The images below breakdown the years 2022, 2023, 2024 and 2025.
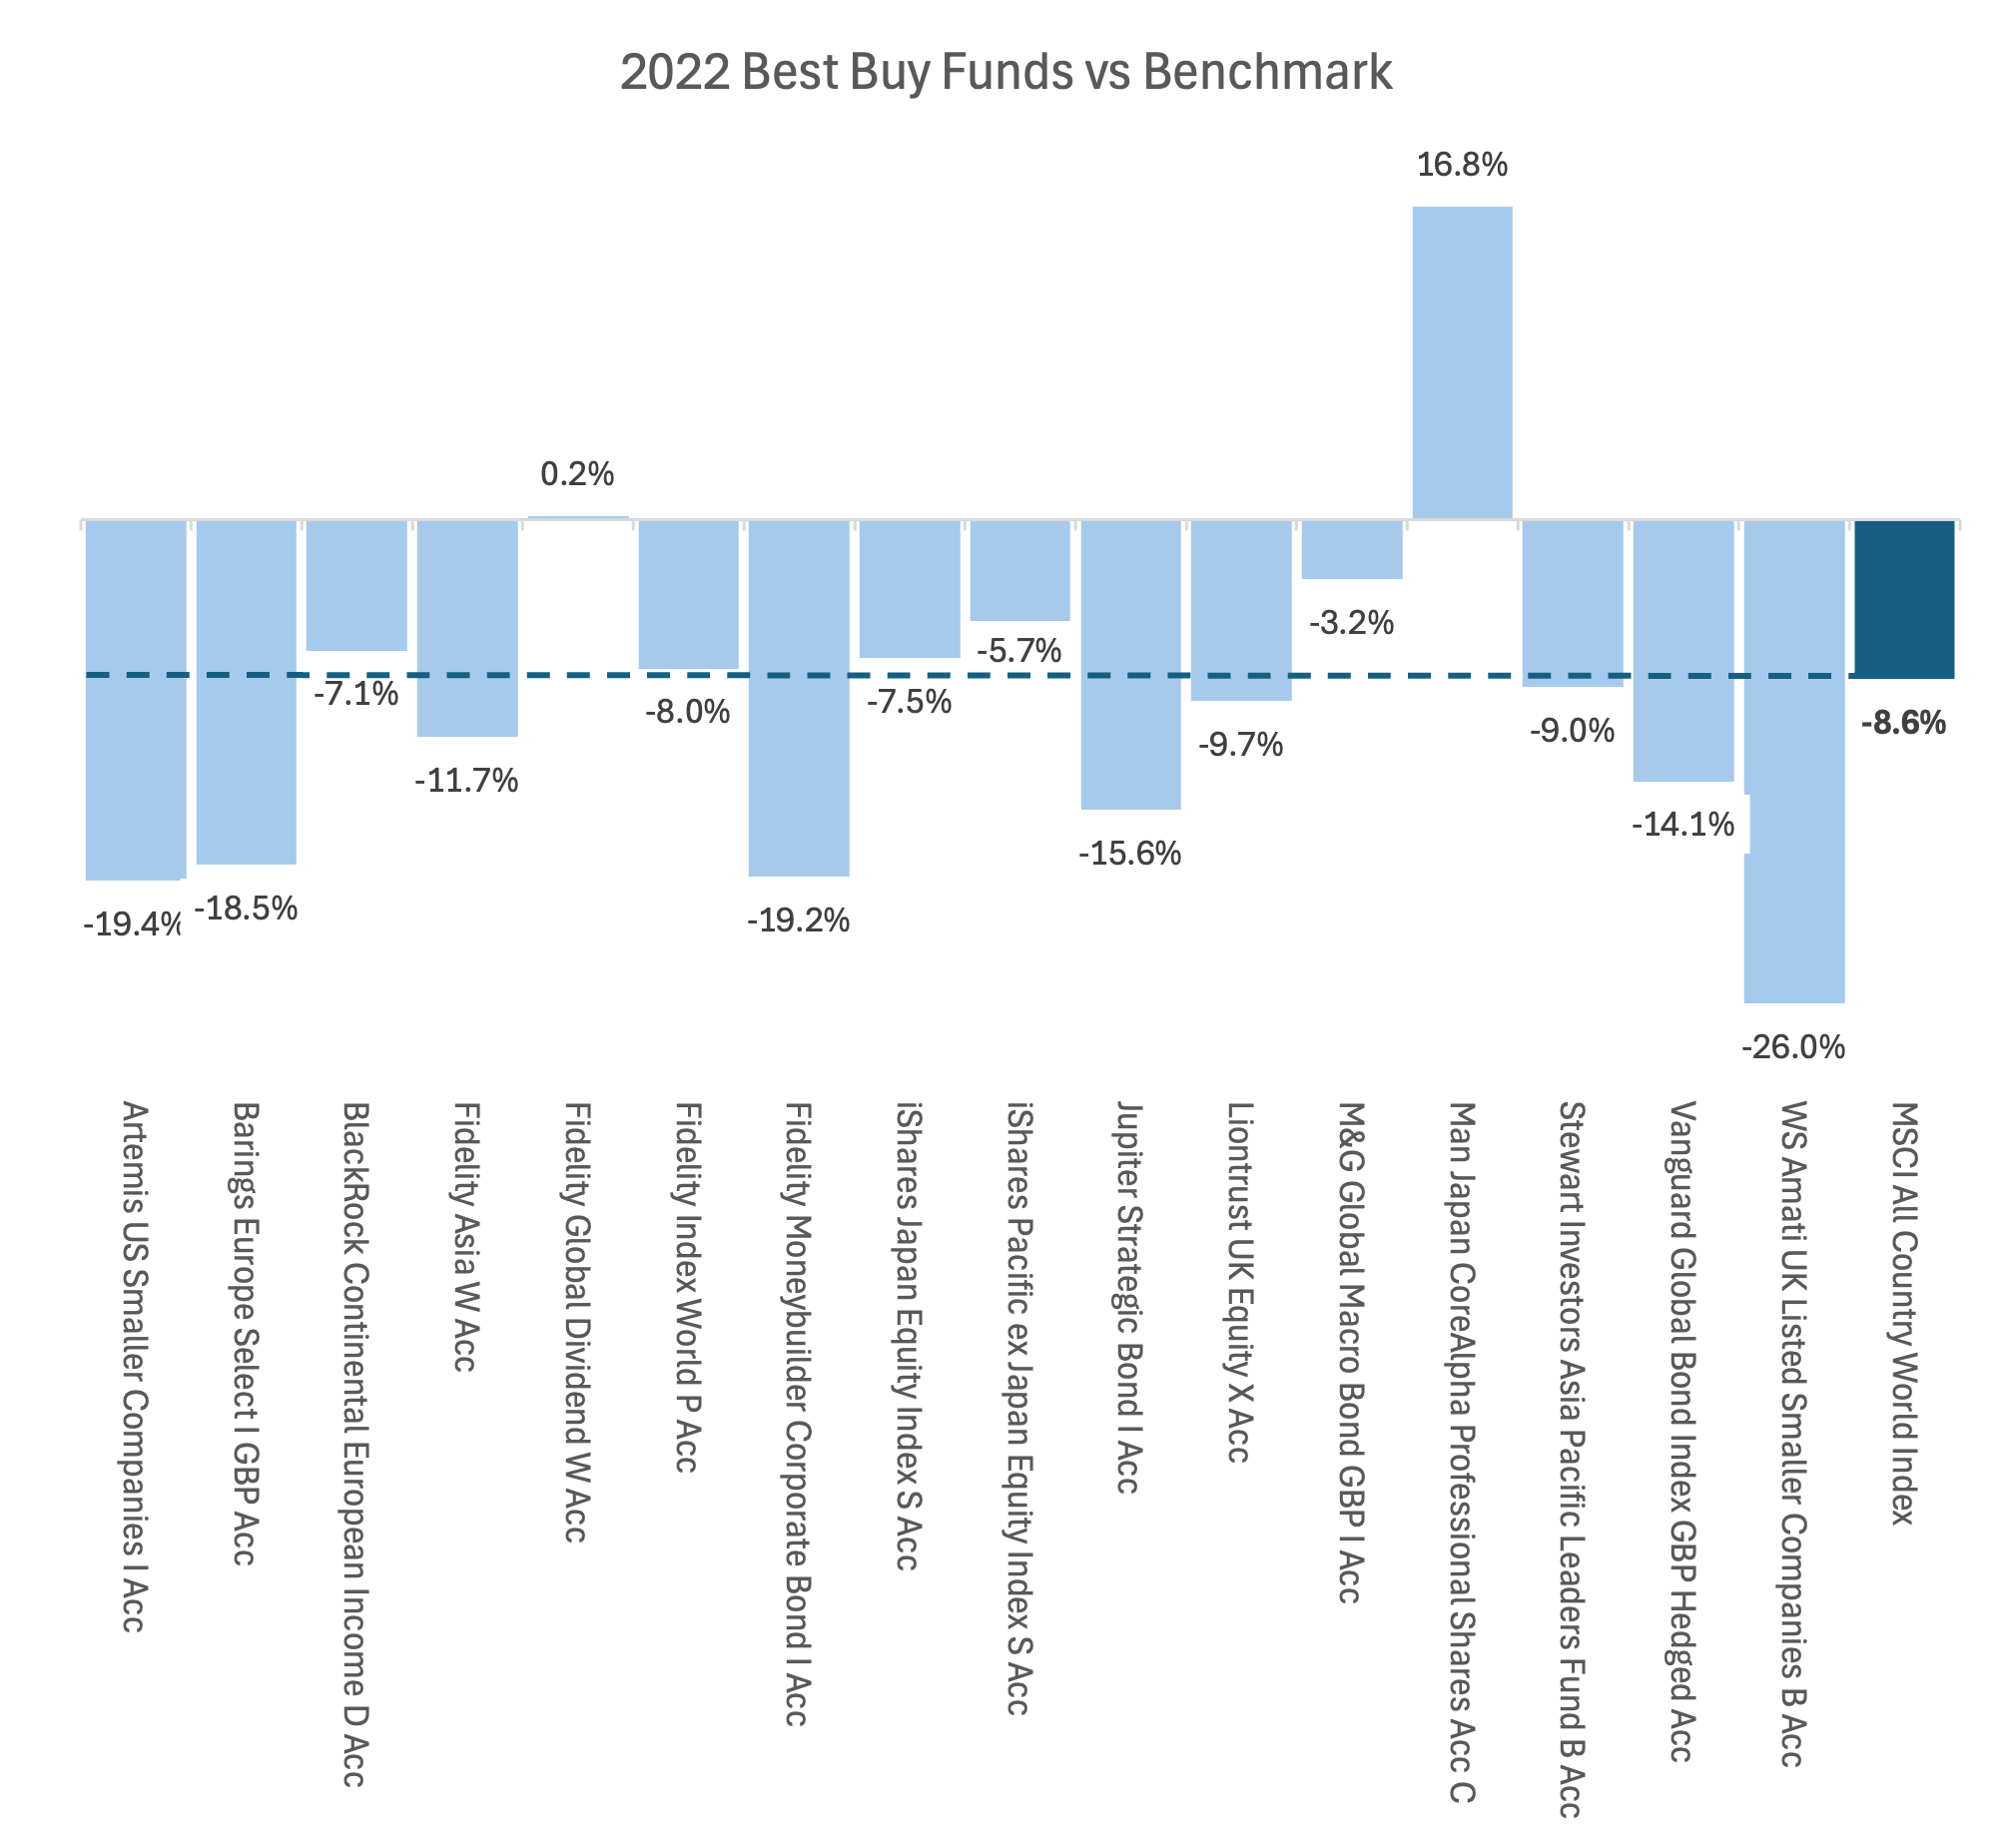
In 2022, 10 out 16 funds underperformed our benchmark. And only 2 had a positive return at all.
In 2023, only 1 fund out 15 beat the benchmark.
In 2024, 3 out of 18 funds beat the benchmark.
In 2025, 10 out of 20 funds won.
Not a great track record, so far. If you were picking individual funds from the lists, your chances of success were dire.
But how would it look if you owned the whole list?
If you bought every fund on the list, you’d have a fairly diversified portfolio.
Assuming you equally weighted the funds, your exact allocation would change over time, but broadly it would have been:
- Equities – 71.25%
- Gold – 2.64%
- Bonds – 26.11%
Reasonably diversified across asset classes, and you even managed to invest in gold, right before its blockbuster returns over the last two years.
Over the 4 year period, the best-buy portfolio return 122.23% – not bad at all.
Unfortunately though, our market portfolio still wins. The MSCI All Country World Index, returned 144.77% over the same timeframe.
Even if we use an apples to apples comparison, using only the equity funds from the best buy lists, you still underperformed with returns of 126.54%.
What’s a better approach, instead of reading best buy lists?
A good starting point is instead of looking for the needle in the haystack, own the haystack – buy the market portfolio.
Most funds underperform the relevant market index over a medium time horizon. The SPIVA scorecard below, shows by just how much.

Globally, over 5 year period 94% of funds underperformed the index! But what about those few funds that beat the market over time?
Whilst it might seem like luck, or skill, there’s another explanation. Academic research has some insights into why the performance of some funds persists over time – something called investment factors.
Nobel Laureate Eugene Fama & Ken French developed their 5-Factor Model, which identifies how most funds which outperform, are pursuing a factor based investment approach. Their investment choices inherently target either company size, quality of earnings, price momentum or relative valuations.
But you don’t just have to pursue these through a judgemental investment approach. Systematic investing, uses quantitive strategies with rules-based systems to target these factors.
…more on that in another blog soon.


